LS -- B version -- Instructions
Copyright © 1999-2001 Samuel L. Baker
LS performs linear least squares regression analysis. In broad strokes, here is what you do:
- Type your data into a spreadsheet, in the specific format described below.
- Copy the data from your spreadsheet.
- Paste the data into the upper box on the LS page.
- Use checkboxes to select your variables.
- Click buttons to perform operations.
- All the results go into a text area box on the screen.
- To save or print your results, copy the contents of that box back to your spreadsheet or to a word
processor.
Copying from the results box can be tricky. The right method for you depends on your operating system and browser version. See Details on How to Copy and Paste from the Results Box below.
Preparing your data
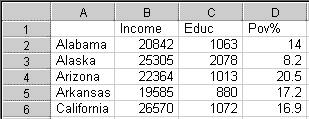
In your spreadsheet, your data should form a contiguous block that looks like the picture. The block does not have to start in cell A1, even though this example does.
The upper left cell can be blank or anything. LS ignores it.
The left column is for observation names. In this example, the observations are states. If you have no observations names, leave the first column blank. In this example, that would mean leaving the A column blank and starting your data in the B column. (Later, when you copy the data, before to include the first column, even if it is blank.)
The top row, starting with the second column, is for variable names. It is not necessary to have your variables in any particular order, nor is it necessary to exclude variables that you do not intend to use. The variables in this example are personal income percapita and elementary and secondary education spending percapita in 1997, and the percent of the population in poverty in 1996.
The rest of the block of cells is for data. Data must be numbers. The Numeric Format must be General or some other format that uses no $ signs, commas, or parentheses. (To change the Numeric Format, select the cells and right-click. If you have a one-button mouse, pressing the Ctrl key while you click is the equivalent of right-clicking with a two-button mouse.)
Copying Your Data
Use your mouse, or the Shift key with the arrow keys, to select the block of cells containing your data. The upper left corner of your selected area should be the blank cell at the top of the column reserved for observation names. The lower right corner of your selected area should be the last observation on the last variable.If you have no observation names in the first column, so the first column is blank, include it in the selected area anyway. Do not include any other blank columns or rows.
Use your spreadsheet's copy command to copy the selected block. On Windows computers, Ctrl+C usually works, as does selecting Edit and Copy from the menu.
Pasting Your Data
Start up or switch to the web page with LS. Click in the upper box. Issue the paste command. The exact command to use may vary, depending on your computer's operating system and your browser. Shift+Insert should work, as may Ctrl+V. It may not work to select Edit and Copy from the browser's menu.If the paste is successful, your data will appear in the upper box as numbers separated by spaces, which are actually Tab characters. It is not a problem if the numbers do not appear to be neatly lined up.
Press button 2 to get LS to read in your data. If your data are read successfully, checkboxes appear below the lower box. These checkboxes let you pick your variables for your regression, first your dependent variable and then your independent variables. Please scroll down as necessary to see them.
Data Problems
If LS reports data problems, either blank cells or cells that are not numbers, switch back to your spreadsheet, fix the data, and copy and paste again.Before pasting again, erase the entire contents of the LS's upper box. One way to do that is to click in that box, press Ctril+Home, press and hold Shift while you press Ctrl+End, and press Delete. Verify that the box is empty by using the arrow keys to try to move around. Then press Ctrl+V or Shift+Insert to paste in your data.
Results Windows
LS -- B version -- displays results in the middle text area box. When your data are read successfully, a table of Means and Standard Deviations and a table of Correlations are added to the box. Each time you produce new results, such as by clicking the Go button to run a regression, the results are added to the text area. If you wish, you can do all your analyses and then one big copy-and-paste to transfer the results to your word processor.Copying and Saving or Printing Your Results
To save and print your results, select, copy, and paste them into a word processor. The results are plain text, to facilitate copying.If you ask for the Predicteds and Residuals, the numbers are separated by tabs on each line. This allows you to paste into a spreadsheet, and have the numbers form two neat columns. You can then use the predicted values and the residuals in graphs or for further calculations.
Details on how to copy and paste from the results box:
Click in the results box and select the text using your mouse or the shift key and arrow keys. To select the entire contents of an output window, press Ctrl+A. If that doesn't work, press Ctrl+Home, then press and hold Shift while you press Ctrl+End.Now press Ctrl+C to copy the text. Switch to your word processor. In Windows, pressing Alt+Tab is one way to do that. (Pressing Alt+Tab repeatedly cycles among your open applications.) If your word processor is not currently going, you can start it up by pressing the Windows key or by pressing Ctrl+Esc. (This is for Windows machines, of course.) Choose the selection from the menu that starts your word processor.
In your word processor, move to where you want to text to go. Then paste the text in with Ctrl+V.
If Ctrl+V does not work, try Shift+Insert. If that does not work either, switch back to the LS page. Select the text as described above, then press Shift+Delete. The selected text should disappear. Press Shift+Insert if you want to paste it back in. If both of those operations work, switch to your word processor and press Shift+Insert to paste.
Formatting the text in your word processor
The columns in the pasted text will probably not line up, because most likely your word processor is using a variable-width font. You can make the columns line up by changing to a fixed-width font, such as Courier New. Select your text, perhaps by clicking and dragging with your mouse, then check your word processor's menu for a Font command.
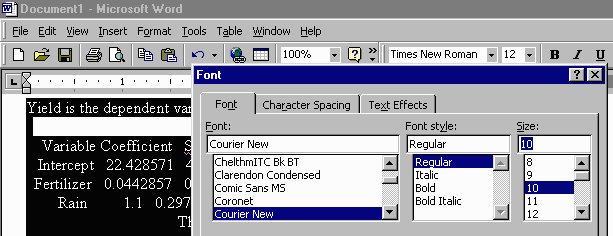
In Microsoft Word, for example, after you have all the text selected,
click on Format on the top menu, then Font. In the dialog box that
appears, change the font to Courier New or some other fixed-width font.

You may also want to change the size to 10 if the default is larger,
as I have done in the picture above. The smaller font will shorten
the lines of text, so they do not wrap around to the next lines.
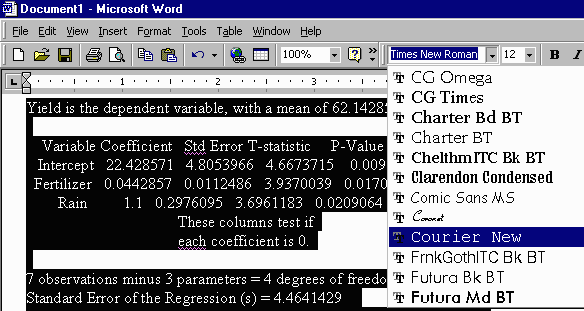
If you have Word set up so the toolbar is showing, as mine is, you can
use pull down menus on the toolbar to change the font face and size, like
this:

You can add your comments to your Word file, if you like, and print your report using Word's print command.
Back to LS
When you are done reading or printing these instructions, use your browser's Back button to go back to your LS page.http://hadm.sph.sc.edu/courses/j716/Copy%20of%20ls/lsinstructions.html
The views and opinions expressed in this page are strictly those of the page author. The contents of this page have not been reviewed or approved by the University of South Carolina.