Copyright © 1999-2000 Samuel L. Baker
Markets, Supply, and Demand
Why study markets, supply and demand?
- To predict what a market will do.
-
In health care, this would be how much and what kind of health care is provided, by whom and
to whom.
- To critique a market and develop policies for improving its performance
-
To find ways to change health care markets so their outcomes are more efficient and
better reflect our values and ethics.
Market
For any particular good or service:
-
Buyers
-
Sellers
-
How they interact
Markets determine prices and quantities
For most goods and services, and for most resources, the interaction of buyers and sellers through markets determines:
- The quantities of goods and services used and produced
- The qualities of the goods and services
- The prices at which the goods and services trade
- These prices become, in effect, the opportunity costs
- For example, if a carton of milk has a price one-half that of a carton of orange juice, then each the opportunity cost in terms of milk of one carton of orange juice is two cartons of milk.
a half gallon of orange juice costs
Markets play crucial roles
Markets
- provide the context for economic decisions by individuals and managers of institutions
- because, as just mentioned, the market prices are the opportunity costs you use in making decisions
- and markets add up individual decisions to make social decisions.
- For example, if a hurricane is approaching, markets add up individuals' desires for emergency supplies and get the stores to stock those supplies.
A "market" is somewhat of an abstraction<
A market, in the economics sense, is not usually one location, like the Farmers' Market or Wal-Mart.
"Housing market" is an everyday usage that is close to the economics
concept of market.
Exchange
Buyers and sellers make up a market.
Buyers and sellers engage in "exchange."
Exchange = voluntary trading of things of value to the participants.
Typically, in a modern economy, the trading takes the form of:
- money being traded for the good or
service that defines the market.
-
Money is a universal store of value (with no intrinsic value of its own).
Exchange is central to the concept of "market."
Economists see exchange everywhere
... even where money is absent
Even in command-control situations
-
If the individual has any discretion at all.
Main usage of "market"
Money is traded for a good or a service.
Buyers and Sellers
Buyers exchange money for the particular good or service.
Sellers exchange the good or service for money.
A market is defined by ...
... the good or service being bought and sold in that market.
The term "market" is best used narrowly, to mean the market for a specific good or service.
For example, the idea of a "hospital market" is too broad.
Why?
- People don't buy undifferentiated hospital services.
Rather, people buy specific services, like emergency care, OB,
heart surgery, etc.
What we might call the metro Columbia, SC, "hospital market" ...
includes six acute care hospitals:
-
Palmetto Health Alliance
-
Providence
-
Lexington
-
Dorn VA
-
Moncrief Army
-
Thomson Student Center
But there is no specific market in which all 6 participate.
- Only the first 3 serve the general public.
- Only two offer open heart surgery.
- Only one has high level neonatal intensive care.
By the way, notice that Palmetto Health Alliance counts as one hospital, even though it has two acute care hospital facilities. (The Alliance has a third facility in Easley, but it is in a different geographic market, near Greenville.)
The Alliance counts as one because its pricing and output decisions
are coordinated among its component units.
Supply and Demand
Sellers and Buyers
The sellers in a market are on the supply side of the market.
The buyers are on the demand side.
Supply and demand are each price-quantity relationships
Supply and demand are not simple quantities
Demand is a relationship showing the quantity buyers will buy at various
prices.
The demand relationship can be expressed as a table or a graph, showing
prices and corresponding quantities demanded.
The notion of price may be expanded to include time, travel, inconvenience,
discomfort, ..., whatever the buyer must give up or endure to obtain the
product or service.
Supply, too, is a relationship.
Supply and demand are not quantities. Rather, for supply, for example ...
Supply is a relationship showing the quantity sellers will sell at various
prices.
The supply relationship can be expressed as a table or a graph, showing
prices and corresponding quantities supplied.
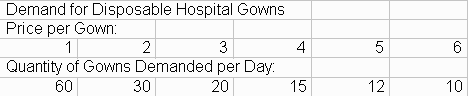
Example of a demand relation
(from the economics interactive tutorial on demand)
A demand relation in table form
For each price, the table shows the quantity demanded at that price.
Example of a demand relation (continued)
(These numbers are from the example in the interactive lecture on demand.)
A demand relation in graph form
For each price, the corresponding dot on the graph shows the quantity
demanded at that price. (Compare the graph below with the table above.)
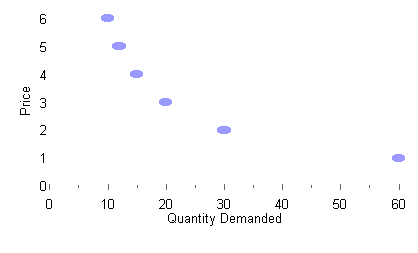
Economists draw demand and supply diagrams sideways -- transposed
Economists put the price on the Y-axis and the quantity on the X-axis.
Even though we usually think of price as the independent variable.
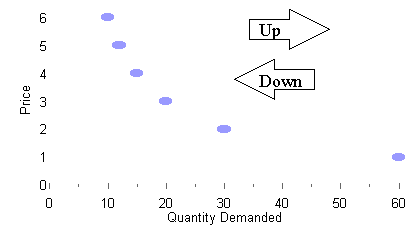
"Up" is to the right.
"Down" is to the left.
Discreet and continuous graphs
The graph above has discreet dots because the table it's derived from has
entries only for whole-number prices.
If we imagine that all in-between prices are possible, too, we can get
a continuous graph like this.
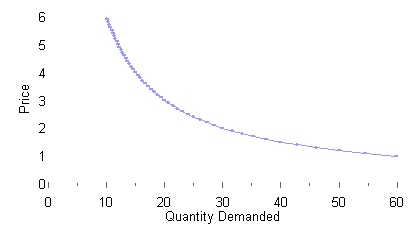
Demand graphs usually slope down from left to right
Downward slope because people buy less when the price is high than they
do when the price is low.
Why a downward slope to demand?
Why do people buy less when the price is higher?
On the demand side, buyers have to solve their individual versions of
the Economic Problem.
Most everyone has a limited budget, a fund of money you can spend.
You have to decide how to allocate your budget money among all the
things you need or want.
Why a downward slope to demand? (continued)
Why do people buy less when the price is higher?
The higher the price of any one thing you want, the more other things
you give up when you buy it, because you have less money left over.
Higher price items have a greater opportunity cost for you.
So you buy less of something when its price is higher.
- See how I work in the concepts of tradeoffs and opportunity cost?
An example of a supply relation
In table form
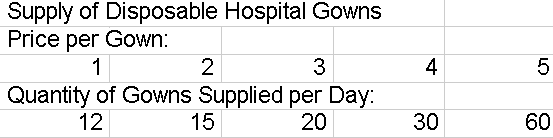
For each price, the table shows the quantity sellers will supply (offer
for sale) at that price.
An example of a supply relation
In graph form (compare point-by-point with the table above)
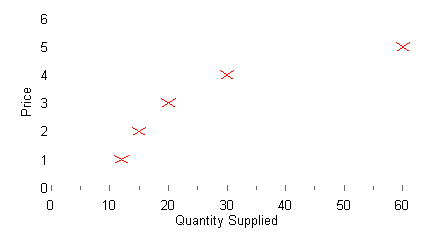
For each price, the graph shows the quantity sellers will supply (offer
for sale) at that price.
Supply graphs usually slope up from left to right
The higher the price is, the easier it is to make a profit selling in this
market.
High prices attract more sellers and induce an expansion of production.
Superimpose supply and demand to find the Equilibrium
Table form
The price at which the quantity supplied equals the quantity demanded
is the equilibrium price.
The corresponding quantity is the equilibrium quantity.
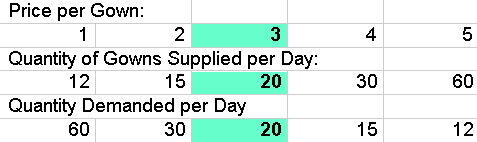
Below, we'll see why it's called "equilibrium."
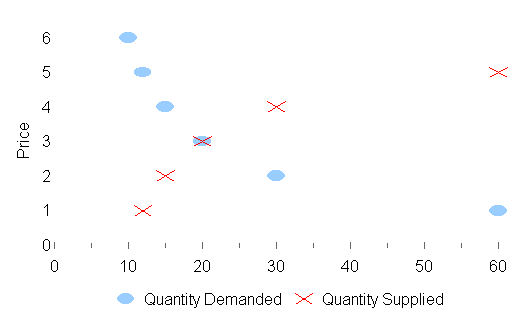
Superimpose supply and demand to find the Equilibrium
Graph form
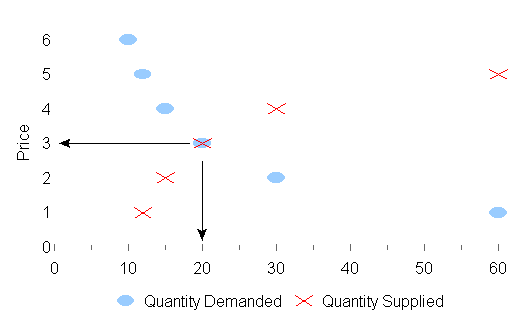
The equilibrium is where supply and demand cross.
Equilibrium price and quantity
In this example, $3 is the equilibrium price.
20 is the equilibrium quantity.
At a price of $3, quantity demanded equals quantity supplied.
At prices below equilibrium, there is excess demand.
Here, quantity demanded exceeds quantity supplied.
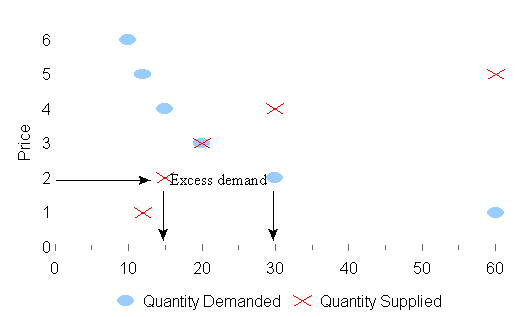
At a price of $2, quantity demanded is 30, but quantity supplied is
only 15. Excess demand is 15.
Why the intersection of the supply and demand curves is called "equilibrium."
Competition in the market tends to make the price move towards the equilibrium
price,
which makes the quantities supplied and demanded converge on the equilibrium
quantity.
Excess demand or excess supply put pressure on the price.
If the price is above or below the equilibrium price, quantity supplied
is different from quantity demanded.
This difference is called "excess demand," if the quantity demanded
is greater, or
"excess supply," if the quantity supplied is greater.
At prices above equilibrium, there is excess supply.
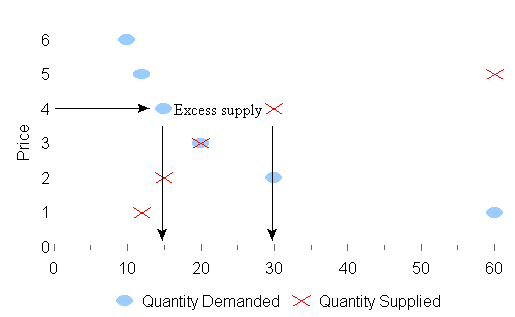
At a price of $4, quantity supplied is 30. Quantity demanded is only
15. There is excess supply of 15.
When there is excess supply, that puts pressure on the
price.
When the price is above equilibrium, there is excess supply.
Sellers
can't sell all they wish they could at the current price.
Each seller thinks: "If I shave my price just a little, I can sell
more of my stuff and make more money."
All it takes is a little competition among sellers, and the market
price starts going down, towards the equilibrium price.
When there is excess demand, that puts pressure on the
price.
When the price is below equilibrium, there is excess demand. Buyers can't buy all
they wish they could at the current price.
Each buyer thinks: "If I offer just a little more, I can buy more but
still be getting a good deal."
Or the sellers notice that there are lots of buyers, and figure they
can get away with a price increase.
All it takes is a little competition among buyers, and the market price
starts going up.
When the price is such that quantity demanded equals quantity supplied
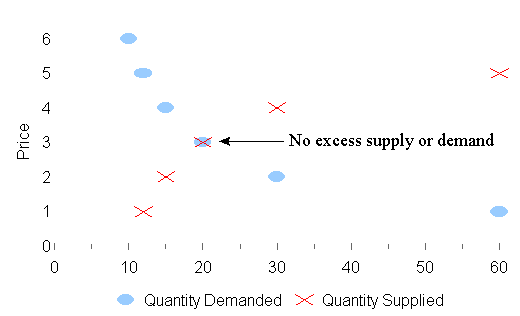
there is no excess demand or excess supply,
so the price is under no pressure to move.
That's why the point where the supply and demand cross is called Equilibrium.
Like a balance scale with equal weight on each pan, there is no tendency
to change.
Markets don't always tend toward equilibrium
Speculation - when demand or supply depend on expectations
-
Expectations means basing decisions on what you expect other people to
do.
-
Can cause speculative "bubbles"
Demand example - Internet stocks overvalued?
- They've come down some since this was recorded, but they are
still overvalued by traditional measures.
Supply example - When each world's tallest building is built, it's
usually a bust.
Ordinarily, markets do tend towards equilibrium
Or, we assume that they do
When prices and quantities change
we explain that by movements in supply and demand.
Supply moves up, so the price goes down
The supply curve is purple. The demand curve is blue.
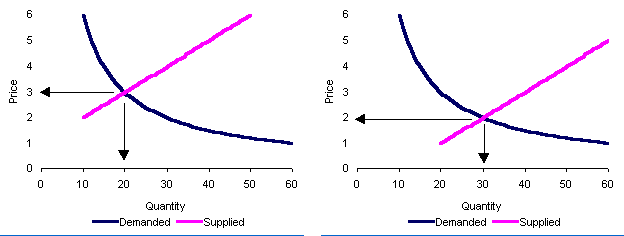
The right diagram has the higher supply curve. Up
is to the right.
When supply goes up, the equilibrium price falls and the equilibrium
quantity increases.
In this example, the equilibrium price drops from $3 to $2, and the
quantity rises from 20 to 30, because the supply has moved up.
Why might supply move up?
Supply can move up if a production input's price falls.
For example, when OPEC increases crude oil production, crude oil's price falls. The supply curve for gasoline moves up -- to the right on the graph -- because at any given gasoline price -- filling stations will be able to get and sell more gasoline.
As the supply curve for gasoline moves right, the intersection point with the gasoline demand curve moves down and to the right. Gasoline's equilibrium price falls and its equilibrium quantity rises. More gasoline is sold, at lower prices.
When supply falls, the reverse happens. Less gasoline is sold, at higher prices.
Demand can change, too
When demand (blue curve) goes up, the equilibrium price rises and the equilibrium quantity rises, too.
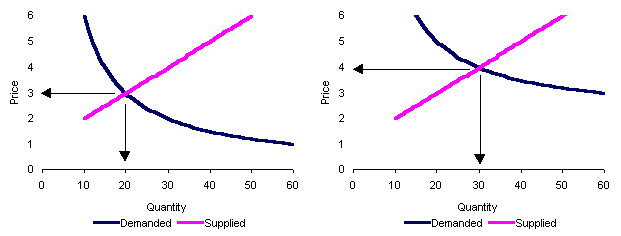
In this example, the price rises from $3 to $4, and the quantity rises
from 20 to 30, because the demand has moved up.
Demand can go up if
-
people want the product more
-
or if people have more money to spend.
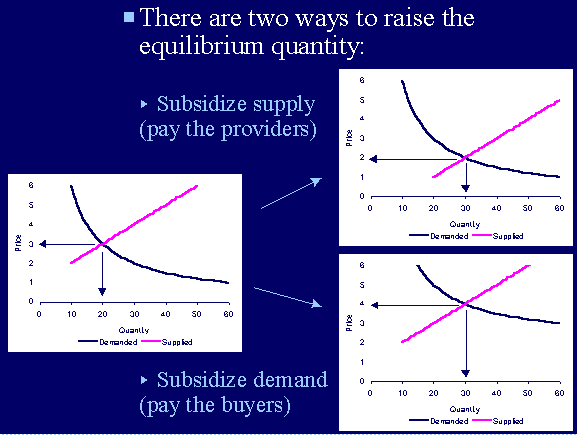
Manipulate the quantity by manipulating supply or demand
Suppose you want to do something like increase the number of people who
get vaccinated.
There are two ways to raise the equilibrium quantity:
-
Subsidize supply (pay the providers)
-
or Subsidize demand (pay the buyers)
Digression: "Market" and "marketing" are not the same idea.
While we're on the topic of markets, supply and demand, let's pause to
talk about "marketing."
In economics, a market has a demand side and a supply side.
Marketing in the business sense refers only to the demand side of a
market.
Marketing is demand management.
Markets as information systems
Markets bring together
-
Consumer wants and preferences
-
Budgets
-
Supply availabilities
to produce an allocation of resources and a distribution of goods and services.
Markets as information systems (II)
The price carries the information.
Potential buyers and sellers can react to the price.
-
That's all they need to know (in theory).
By responding to prices, each person adjusts his or her resource utilization
to fit with resource availabilities for the whole society.
-
Goods that use scarcest resources carry the highest prices. The people
who get those goods are those most willing (and able) to forgo other things.
Markets as information systems (III)
Markets, if they are functionally properly, are highly responsive to changes in
-
Consumer wants and preferences
-
Budgets
-
Supply availabilities
Markets: Worldwide economic coordination, very fast, with no central authority
-
E.g., suppose a frost in Brazil lowers the supply of coffee. This
raises the price.
-
Consumers need know nothing about Brazil. The higher price tells them to
drink less coffee and substitute other beverages.
-
Meanwhile, other growers, responding to the higher price, expand production. The price carries the information.
In recent years, the expansion of natural gas production lowered the price so much that electric utilities are mothballing coal-fired power plants and building gas-fired plants. The changes in the gas price relative to the coal price is the main force propelling this change. Environmental regulations have been secondary to this switch.
Markets are not perfect
Distributional issues
Initial distribution of wealth determines market outcome.
In a system based on trading, how much you finish with depends on what
you start with.
-
Moral/ethical problems with some market outcomes, particularly in health
care.
Also, markets can have allocation problems
Inefficiencies
If certain conditions are not fulfilled.
-
Consumer information
-
Viability of competition
In class, we'll discuss these issues as applied to health care.
This lecture:
Key ideas
-
Market
-
Buyers and sellers
-
Supply and demand
-
Together, supply and demand determine market behavior.
-
In this way, the market produces a solution to the economic problem - an
allocation of scarce resources and a distribution of goods and services.
-
It may or may not be the best solution, but it is a solution.
The views and opinions expressed in this page are strictly those of
the page author. The contents of this page have not been reviewed or approved
by the University of South Carolina.
E-mail: