Copyright © 1999-2000 Samuel L. Baker
New! Added comment about cost-saving and cost-effectiveness.
Sound instructions: Click the sound buttons to play the voice
recordings.
Click again to stop the play.
If you are viewing this over a telephone modem internet connection,
playing the voice recordings involves loading delays of several
minutes.
Cost-Effectiveness Articles
- Eddy, "Screening for Cervical Cancer"
- Fries, "Reducing Health Care Costs by Reducing the Need and
Demand for
Medical Services"
- Russell, "Prevention"
- Huntington,"For Every Dollar Spent -- The Cost-Savings Argument
for
Prenatal
Care"
- Eddy, "Oregon's Methods: Did Cost-effectiveness Analysis Fail?"
You may wish to have the articles handy as you go through this recorded
lecture.
Eddy, "Screening for Cervical Cancer"
Annals of Internal Medicine, August 1, 1990, 113(3), pp. 214-226.
Neuhauser (stool guaiac study discussed in preceding lecture) method
applied to real example. Marginal cost per year of life saved by PAP
test
rises quickly as testing gets more frequent.
Eddy -- data sources and false positives
Based on International Agency for Research on Cancer (IARC) study
involving
1.5 million women in 8 countries.
Eddy uses IARC's best false positive rate of 0.5%, which is achieved
in countries with
a centralized government-run lab system. Big controversy broke in 1990
over
US lab accuracy, with false positive rates as high as 5%.
False positives lead to expensive further tests as well as anxiety
for
the woman. Even at an 0.5% false positive rate, a woman who gets 20
tests
in her lifetime is 4 times as likely to get a false positive as to
actually
have cervical cancer.
Eddy -- cancers found and years of life saved
Neuhauser, for simplicity, assumed that every cancer found is a life
saved. Eddy notes that only about half of women who get cervical cancer
die from it.
Eddy reports years of life saved rather than lives saved. This makes
saving a younger woman more valuable than saving an older woman.
He calculates that women who get screened every four years live an
average
of 93.8 days longer than women who don't get tested at all.
Increasing the frequency of screening increases life expectancy, but
the gains are smaller. E.g., going from testing every 4 years to
testing
every year increases life expectancy by about 5 days.
Eddy -- years of life saved at different frequencies of testing
This and the following tables are adapted from Eddy's on page 218.
Some numbers are changed to correct what appear to be errors in the
original.
I'll leave out some of Eddy's columns for brevity, and add some rows
for clarity.
| Test every this many years |
4 |
3 |
2 |
1 |
Days of life gained, on average,
compared with women who are never tested |
93.8 |
95.4 |
96.9 |
98.6 |
Eddy reports how many days of life are saved on average at various
frequencies
of testing. The number in each second row cell is how many days of life
are saved by testing at that column's frequency, compared with not
having
any tests at all.
Eddy discounts future years of life saved
| Test every this many years |
4 |
3 |
2 |
1 |
Days of life gained, on average,
compared with women who are never tested |
93.8 |
95.4 |
96.9 |
98.6 |
| Days of life gained, discounted at 5% |
9.54 |
9.72 |
9.88 |
10.07 |
In the third row above, Eddy discounts the future years of life
saved
at a 5% discount rate.
Eddy bases his numbers on a hypothetical 20-year-old woman looking
forward
to the rest of her life, trying to decide how often to have PAP tests.
Suppose a 20-year-old woman decides to get regular PAP tests. One
possibility is that, when she is 70 years old, a cancer will be found
that would have caused her death at age 75. The early detection allows
the woman to live to be 80. Those 5 years of life saved are 55 to 59
years
in the future, so Eddy says they are only worth this much today to the
20-year old woman:
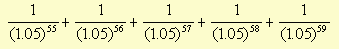
This totals about 0.31. Saving 5 years of life 55 years from now
is valued at 0.31 years today, by this methodology.
(If the formula above is mysterious to you, please take time out to
look at the interactive lecture on
discounting
future income.)
Suppose instead that her first PAP test finds a cancer that would have
caused her death at age 21. Now Eddy would calculate the value this
way:

These 59 terms add up to 18.9 years. 59 years of life saved are valued
at only 18.9 years, when the future years are discounted to the
present.
To sum up: Discounting the future years of life saved, using this
methodology, has
two effects:
- It makes the savings total smaller, so the cost per year of life
saved
looks
bigger.
- It puts even greater relative value on saving a young person's
life,
compared
with saving an older person's life.
|
Years of life saved |
Discounted years of life saved |
| Saving a 21-year-old |
59 |
18.9 |
| Saving a 75-year-old |
5 |
0.31 |
| Ratio of life values |
12:1 |
61:1 |
A general point about economics: Even what appear to be technical
analyses have moral and ethical issues
in their assumptions and methods.
Eddy calculates the net costs of testing regimens
Here are the net lifetime costs of each frequency of testing, as seen
by
a 20-year-old woman. Future costs are discounted at 5% per year and
added
up.
| Test every this many years |
4 |
3 |
2 |
1 |
| Net cost over lifetime, discounted at 5% |
$264 |
$355 |
$470 |
$1,093 |
- (The $470 figure is different from what's in the printed article,
but I
believe the article's number is in error.)
These are net costs. Eddy subtracts, from the costs of the
tests,
the costs saved by not having to do surgery or other treatment on
people
whose disease was prevented.
This is an important point. This test does not save money.
Giving
all women PAP tests does
not reduce total health care spending.
The myth that "health maintenance" pays for itself with dollar
savings.
Eddy -- average costs per year of life saved
Suppose we analyze costs the wrong way, using average cost.
| Test every this many years |
4 |
3 |
2 |
1 |
| Net cost over lifetime, discounted at 5% |
$264 |
$355 |
$470 |
$1,093 |
| Days of life gained over no testing |
93.8 |
95.4 |
96.9 |
98.6 |
| Days of life gained, discounted at 5% |
9.54 |
9.72 |
9.88 |
10.07 |
| Average cost per year of life saved |
$1,028 |
$1,359 |
$1,772 |
$4,049 |
| Average cost per discounted year of life saved |
$10,108 |
$13,340 |
$17,375 |
$39,644 |
For testing every year, the most expensive (and most recommended)
regimen,
the average cost per year of life saved doesn't look bad.
Even with discounting future benefits, the cost, at $39,644 per year
of life saved, is less than a kidney machine (renal dialysis).
Testing
every year looks pretty good!
Eddy -- marginal cost per year of life saved
Analysis using marginal cost shows that annual PAP tests are expensive
per year of life saved, compared with testing every two years or every
three.
In the table below, the marginal cost in any one column is the
difference
in cost between that column's cost and the cost of the column to the
left.
For the first column, the marginal cost is the difference between every
four years and no tests at all.
| Test every this many years |
4 |
3 |
2 |
1 |
| Net cost over lifetime, discounted at 5% |
$264 |
$355 |
$470 |
$1,093 |
Marginal lifetime cost, discounted at 5%
(The difference between net costs) |
$264 |
$91 |
$115 |
$623 |
| Days of life gained over no testing |
93.8 |
95.4 |
96.9 |
98.6 |
Marginal gain in days of life
(The difference between days of life gained) |
93.8 |
1.6 |
1.5 |
1.7 |
| Days of life gained, discounted at 5% |
9.54 |
9.72 |
9.88 |
10.07 |
Marginal gain in days discounted at 5%
(The difference between numbers in the row above) |
9.54 |
0.18 |
0.16 |
0.19 |
Marginal cost per year of life saved
(365 times marginal cost divided by
marginal gain in days of life saved) |
$1,028 |
$20,774 |
$28,003 |
$133,853 |
Marginal cost per discounted year of life saved
(365 times marginal cost divided by
marginal gain in discounted days of life saved) |
$10,108 |
$184,654 |
$262,523 |
$1,197,636 |
If you accept the idea of discounting future years of life saved,
annual
(as opposed to bi-annual) PAP tests cost $1.2 million per year of life
saved.
Eddy -- rapidly diminishing returns
In the table above, we see that
the returns from more frequent testing diminish rapidly as the
frequency
of testing increases.
This is because most cervical cancers develop slowly.
Nevertheless, most doctors recommend annual testing.
If you were running an HMO, what frequency of testing would you pay
for?
Further reading
For more examples like Eddy's, see Russell, L.B., "Some of the Tough
Decisions
Required by a National Health Plan," Science, November 17,
1989,
246,
pp.892-896.
This gives cost-effectiveness numbers -- dollars per year of life
saved
-- for a number of procedures. Most are inexpensive per year of
life
saved, but none of them reduce health care costs. All of them have a
net
cost, even after subtracting savings from the future health care that's
made unnecessary.
For further reading on methodology:
Frank A. Sloan, ed., Valuing Health Care, Cambridge University Press,
1996,
discusses how cost-effectiveness studies handle decisions between
present
benefits and future benefits (or near-future benefits versus
distant-future
benefits), and how cost-benefit studies value human lives saved or
suffering.
Fries, J.F., Koop, E., et al, "Reducing Health Care Costs by
Reducing the
Need and Demand for Medical Services,"
N Engl J Med, July 29, 1993,
329(5), pp. 321-325.
Co-author Koop is the former Surgeon-General of the U.S.
Example of the common argument that prevention saves money.
Foil for Russell's article, which follows.
"Risky Behavior Costs Money," is one subhead. Under it, Fries et al
say there was a $1360 difference in annual medical claims cost between
high- and low-risk persons in one group of employees.
But how much of that risk difference is amenable to intervention,
and
at what cost?
Fries et al say: "Cure for Terminal Illness Has Become
Extraordinarily Expensive and Inhumane."
But, James D. Lubitz and G. F. Riley, "Trends in Medicare Payments
in
the Last Year of Life," NEJM, April 15, 1993, 328(15), pp. 1092-1096,
report
that the 29% of Medicare spending is for people in their last year of
life,
but this showed no upward trend from 1976 to 1988.
So the expense of treatment for terminal illness isn't growing any
faster
than
the rest of expense of prevention and care.
Neuhauser and Eddy show that "cheap" preventive procedures can be
quite
expensive, if judged on dollars spent per year of life saved.
Fries et al cite studies showing cost savings for health promotion
at the workplace.
A possible project for a paper in lieu of an exam in this course
would
be to look up Fries' and Russell's references and evaluate them, plus
look
on Medline for more recent studies. Are Fries et al right that these
programs
save money, or is Russell right when she says that they don't? To what
extent are these authors talking about different programs, whose
potential
for savings differ?
Russell, L.B., "The Role of Prevention in Health Care Reform,"
N Engl J Med, July 29, 1993, 329(5), pp. 352-354.
In same issue as Fries.
Russell asks: Should we claim, or require, that preventive
measures
pay for themselves? Her answer is No.
She criticizes justifying prevention by cost savings to the health
care
system because:
- It's too strict. We spend money (representing social resources)
on
health
care to feel better and live longer, not necessarily to save money
later.
- Hypertension control example.
- Eddy's findings on PAP test are another example.
- There's the paradox that total costs may rise simply because
prevention
helps people live longer.
- Smoking cessation may add to future Social Security costs.
"Prevention should not ... be held to a higher standard than other
medical services."
Russell cites studies showing that prevention programs, for risk
factors
like hypertension and cholesterol, generally don't pay for themselves
in
health care cost savings.
Russell talks about a national health program, but this question has
relevance to prepaid health plans -- so-called "health maintenance
organizations,"
or HMOs. That name was coined to convey the idea that the health plan
would
have an incentive to promote preventive medicine to maintain the health
of the members, thereby avoiding expensive treatment later. But, if
Russell
is right, what does that imply about how HMOs will behave in practice?
Will they really promote prevention?
- For marketing purposes, yes.
- But not to save cost.
S.C. Mental Health Waiver example
Average cost per schizophrenia patient per month for participants in
an experimental intensive case management program, South Carolina,
1990.
| Service |
Average Cost per Patient per Month |
|
Before
Case Management |
During
Case Management |
| CMHC * |
$104 |
$155 |
| Prescriptions |
$28 |
$34 |
| Hospital |
$25 |
$43 |
| Physician |
$16 |
$27 |
| Other |
$1 |
$2 |
| TOTAL |
$175 |
$260 |
* Community Mental Health Center (CMHC) costs are based on what
would
have been billed to Medicaid at fee-for-service rates. CMHC's were
actually
paid a capitated rate.
It is possible that the added costs, consequent to case management,
reduced medical spending needs years later, after the study was
over.
If this were a private HMO, however, it might not realize those
savings.
People change HMOs frequently. That's necessary for a
well-functioning
market, but it further reduces the incentive for an HMO to prevent
illness,
if some other HMO is going to get the benefit.
Huntington, J., Connell, F.A., "For Every Dollar Spent -- The
Cost-Savings
Argument for Prenatal Care,"
N Engl J Med, Nov. 10, 1994, 331(19), pp. 1303-1307.
"Everybody knows" that prenatal care saves money.
But if you examine the studies that support this claim, you see a
lot
of
- shoddy methodology, such as failure to control for confounding
effects,
and
- wishful thinking, basically assuming that the assertion is true.
Political/moral issue:
Should we claim prenatal care is cost-saving even though it isn't?
Could there be a backlash?
Cost-benefit claims helped get Medicaid eligibility expansions
through Congress and state legislatures.
Studies vary considerably in how much effect is found for prenatal
care.
Self-selection makes the effect of prenatal care appear larger than it
actually is. One study didn't correct for the fact that early
delivery itself means fewer prenatal visits.
Most studies assumed that an average or routine level of prenatal care
was effective at reducing premie births. Since the 1990's the
trend has been for intensive prenatal care of high-risk women.
This intensive prenatal care does appear to be effective, but it costs
more than routine care, so the studies are, in effect, underestimating
the cost of prenatal care in their calculations.
Getting more pregnant women to prenatal care earlier requires
overcoming such barriers as lack of transportation, the attitudes of
the women, the attitudes of providers, and enrollment paperwork.
The cost of giving more prenatal care would be greater than the cost of
the care itself.
On the other hand, narrow cost-benefit analysis can overlook benefits
such as happier pregnancies, better relationships between moms and
health care providers, leading to better parenting, greater likelihood
that the child will be immunized, better diet, hygene, or other
health-related habits.
And there's the Russell point -- prenatal care can be a
cost-effective way to improve health, even if it doesn't save money.
For your interest, one kind of prevention that does seem to be
cost-saving
-- reducing total health care system costs -- is contraception. See http://www.agi-usa.org/pubs/journals/2924897.html
. Thanks to Cheryl Brannon for finding this one.
Eddy, D.M., "Oregon's Methods: Did Cost-effectiveness Analysis
Fail?"
JAMA, Oct. 16, 1991,
266(15), pp. 2135-2141.
Oregon attempted to use cost-effectiveness analysis on a grand scale
to decide which health care services should be paid for and which
should
not.
Oregon -- Cost-effectiveness in practice?
Cost-effectiveness studies of repeatable procedures (like the guaiac
and
pap tests) show that there are diminishing returns as the procedure is
repeated more and more frequently.
- Based on this, one can decide how frequently to repeat, to best
balance
the marginal cost of additional repetitions against the marginal
reduction
in risk.
In theory, cost-effectiveness analysis can also be used to choose among
procedures, picking the procedures that save the most lives (or reduce
the risk the most) per dollar spent. If your budget is limited (which
it
always is) this gets you the greatest reduction in death for the money
you have.
Oregon's situation
Oregon in 1990 attempted to apply this theory in practice, with partial
success.
The story begins in 1987, when Oregon's legislature decided to try
to
control Medicaid spending by stopping funding for most organ
transplants.
Medicaid spending -- like a box with three dimensions
The total cost of Medicaid (or any insurance program) can be thought
of as the volume of a box with these three dimensions:
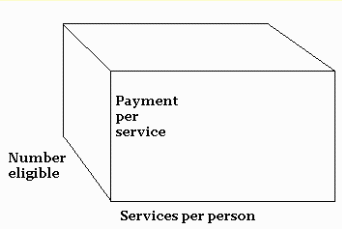
In 1987, Oregon's Medicaid spending box was big, and
growing
fast. The Oregon legislature had to choose which dimension of the box
to
limit.
- It didn't want to cut payments to providers -- it was already
having
trouble
getting providers for Medicaid patients, and there was the Boren
Amendment,
requiring payment rates "… reasonable and adequate to meet the costs
which
must be incurred ..."
- It didn't want to reduce eligibility. There were already many
poor not
eligible.
- So it went to work on the third dimension, the services per
enrolled
person,
using the conventional wisdom that expensive procedures are
expensive.
In particular, it decided that Medicaid would not pay for most organ
transplants.
But then came Coby Howard, a boy suffering from leukemia. His doctors
recommended a bone-marrow transplant. Oregon Medicaid refused to pay.
This sparked public outcry and debate.
Legislators and officials in Oregon needed a defensible way to make
decisions about what services to cover.
The legislature developed a proposal to expand Medicaid and health
insurance
to all Oregonians, while reducing services per person, in order to
control
total spending.
Under the proposal, cost-effectiveness analysis would be used to
objectively
determine which services to fund and which not to fund. That way, when
controversy erupted, they could argue that funds are limited and that,
in return for forgoing some low-benefit-per-dollar services, all
Oregonians
were getting access to basic, high-value-per-dollar health care
services.
If you are interested, Fox, D.M., Leichter, H.M.,
"Rationing
Care in Oregon: The New Accountability," Health Affairs, Summer 1991,
10(2),
pp. 7-27, gives details on the legislative history.
In 1990, the Oregon passed the legislation, which
- expanded health insurance to cover nearly all Oregonians.
- mandated employer-provided private insurance for job holders
- established a state-subsidized private insurance for
high-cost-risk
people
("risk pool")
Medicaid was expanded to all poor, as defined by having a family income
below the Federal poverty level.
- 130,000 Medicaid eligible before expansion
- 210,000 with expansion.
Oregon -- ranking services by cost-effectiveness
Oregon's method:
- Calculate the cost-effectiveness of all services
(procedure-condition
combinations).
- List all the services in order by cost-effectiveness, with the
most
cost-effective
at the top of the list.
- Calculate expected spending on each procedure.
- Go down the list, totaling expected spending. Draw a line where
the
total
equals the amount the legislature is willing to fund.
- Procedures above the line are paid for. Procedures below the line
are
not.
The Medicaid list would also apply to mandated employer insurance
coverage.
Oregon -- The cost-effectiveness calculation
Cost-effectiveness for each service measured by
Expected dollar cost per year of quality-adjusted life saved.
- Eddy, p. 2137, calls this the "Cost-Benefit Ratio," a term I
would not
use, because the benefit here is in years of life, not in dollars.
Oregon -- quality-adjusted life years
Quality-adjusted years of life saved (what Eddy calls Net Benefit of
Service
times Duration) is calculated through several steps.
First, though, we need to discuss the "quality-adjusted" life year.
So far, the studies I've shown you have used just two possible
outcomes,
life and death.
To include procedures that relieve suffering but don't necessarily
save
lives, Oregon used the Quality-Adjusted Life-Year.
- For a full description, by the person who developed this for
Oregon,
see
Kaplan, R.M., "Value Judgement in the Oregon Medicaid Experiment,"
Medical
Care, October 1994, 32(10)pp. 975-988.
The quality adjusted life-year is a number between 0 and 1.
- Dead = 0. Alive and healthy = 1.
- Suffering and disability states are valued between 0 and 1.
- For example, a year of chronic "pain, stiffness, weakness,
numbness, or
other discomfort" was valued at 0.747.
- Theoretically, there could have been a suffering state so
miserable
that
its value was less than 0, but, in Kaplan's results, that did not
happen.
- Kaplan calculated these values based on surveys that asked people
what
they thought of life in various conditions.
Oregon assigned a quality-adjusted life value to every possible outcome
of the procedure either being done or not being done.
Oregon -- expected quality-adjusted of life-years saved for each
procedure-problem
combination
To calculate the expected quality-adjusted life-years saved for a
specific
procedure-problem combination:
- Estimate the probability of each possible outcome with and
without the
procedure
- Multiply each outcome's probability by its quality-adjusted
life-year
value.
- Add up all the products for all outcomes with the procedure and,
separately,
for all outcomes without the procedure. This gives you two expected
values:
- The expected value of life state if the procedure were done.
Eddy calls
this QWBRx. I'll call it EQWBRx (E is for
expected.)
- The expected value of life state if the procedure were not
done. Eddy
calls
this QWBNo. I'll call it EQWBNo
- The difference between the expected values is the expected
improvement
in quality of life from the procedure. Multiply that by the duration of
the effects.
Oregon -- cost-effectiveness calculation continued
See top of page 2137 of Eddy for his formulation. Here's my version:
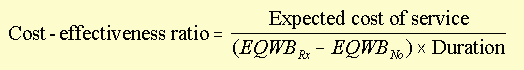
EQWB is the expected quality of well-being. The subscript Rx or No
indicates whether it is with or without the treatment.
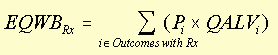
QALV is quality-adjusted life value for each outcome.
Oregon -- cost-effectiveness calculation example
For appendectomy for appendicitis
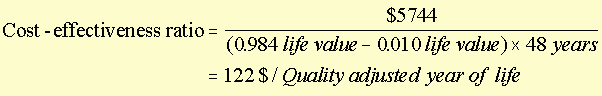
The cost-effectiveness ratio for an appendectomy is 122. The
units of the cost-effectiveness ratio are dollars per quality-adjusted
year of life saved.
- Eddy, p. 2137, top right shows how the EQWB numbers are
calculated by
multiplying
each outcome's value times its probability.
Oregon -- cost-effectiveness calculation simplifications
Eddy points out several simplifications in Oregon's method, such as
a collapsing of categories from the many thousands of possible
combinations
of ICD-9 and CPT-4 codes, which themselves are simplified, to about
1600.
- As an aside, notice that, in contrast with what Eddy did in his
other
article,
Oregon did not discount future costs or benefits, nor did Oregon
calculate
future health care costs saved or incurred as a consequence of the
treatment
today.
Oregon's list was done, but then ...
... people hated it.
Some items seemed out of place. Some rankings seemed counter to
common
sense.
Eddy says, in Oregon's defense:
- That's the whole idea of using cost-effectiveness analysis. If
you
already
know what's important, you don't need cost-effectiveness analysis to
tell
you.
- Some critics didn't recognize the cost side of argument.
- For example, dental caps for pulp exposure ranked nearly as
high as
surgery
for ectopic pregnancy, but the tradeoff is one surgery for ectopic
pregnancy
against capping 105 broken teeth.
Oregon's Health Services Commission revised the list.
- Certain categories of procedures were given higher or lower
priority.
- Within categories, the cost-effectiveness numbers were used for
ranking
but with hand-adjustment.
Oregon -- Were the list's problems technical or conceptual?
Technical problems
- categories too broad
- errors in evaluating outcomes and durations
Conceptual problems
- Does cost-effectiveness violate the Rule of Rescue?
- Eddy (my interpretation) says: Life-saving services have external
value
- External means, for example, that it makes me happy to see you
get
medical
services you need.
- Eddy calls this "vicarious utility."
Eddy suggests reformulating the survey questions to measure the
external
values.
That should take care of Rule of Rescue concerns.
But, the questions that Eddy would ask the public seem even harder
to
answer than the questions that Kaplan asked.
Did Eddy's PAP test article do this?
Oregon went ahead and implemented the priority list, after more
changes.
A "waiver" of Federal Medicaid rules was required to implement the
list.
The US DHHS (under G. Bush Administration) rejected Oregon plan,
claiming
that the quality of life adjustment conflicted with Americans with
Disabilities
Act.
The methodology was further revised to remove the quality-of-life
adjustment.
Kaplan is angry about this, because it discounts treatments that
improve
a disabled person's condition but don't save his life or fully cure the
disability.
More hand-adjustments were made, so that the influence of the
cost-effectiveness
ranking further receded.
Some categories of care, such as for extremely immature babies, were
exempted from the list, so that funding for them was guaranteed.
In 1993, the Clinton Administration granted the waiver.
Cost-effectiveness studies
Summing up:
- Idea: Face squarely the Economic Problem
- Decide how best to spend society's limited sources
- Actually doing it raises methodological questions
- Cost-effectiveness analysis seems to have been judged OK for
evaluating
repetitions of tests.
- For decisions among procedures, as tried in Oregon, the
cost-effectiveness
results were heavily modified before put into practice, and no other
state
has copied Oregon's method.
Take-away points
These ideas came up in class:
- Cost-benefit and cost-effectiveness studies are not definitive.
There's no one right way to do them. All cost-benefit studies involve
choices about what costs and benefits to include and about about how to
value the costs and benefits that are included. Cost-effectiveness
studies all involve choices about how to specify the goal, as well as
about what costs to include and how to value them.
- Cost-saving and cost-effectiveness are not the same thing.
Nor are cost-saving and cost-benefit the same thing. The mental
health patients in S.C. who had standard case management did cost
less than the patients with enhanced case management. That does not
mean that neglect is cost-effective. Nor does it mean that the
costs exceed the benefits. It only means that neglect is cost-saving to
the health care system. The
same goes for giving poor people primary care through the hospital
emergency department. If you get more effect for more cost, then what
you gain on the effect side can be worth the extra cost, making
spending more cost-effectivene. Cost-effectiveness analysis is
supposed to be about comparing alternative ways of meeting the same
goal. If one alternative meets more goals, or meets the goals better,
you can't ignore that and just compare the costs and call that
a cost-effectiveness analysis.
A few words on cost-saving, cost-effectiveness, and feasibility:
I can imagine three possibilities for a preventive measure:
- It pays for itself. The future health care cost savings are more than the cost of the intervention today. Axnick argues that the measles vaccine does this. I call this "cost-saving." Cost-saving preventive actions have no opportunity cost. You don't give up anything, in the long run, when you do them.
- It does not pay for itself. The cost of the intervention is more than the expected future health care cost savings. The intervention has an opportunity cost.
- The intervention is less costly per person than other things we do to save a life or improve someone's health. This makes the intervention "cost-effective." Cost-effective interventions are "economically feasible." PAP tests are an example of this.
- The intervention is more costly than other things we do to save a life. This makes the intervention not cost-effective. This is what you might mean by "not economically feasible." An example of this is that we, in the U.S., generally don't stop vehicular traffic at intersections in all directions at the same time to allow pedestrians to cross safely. Instead, we allow cars to turn and drive across cross walks while pedestrians are crossing the street. Presumably, we do this because stopping cars in all directions is not cost-effective at saving lives or preventing accidents.
The views and opinions expressed in this page are strictly those of
the page author. The contents of this page have not been reviewed or
approved
by the University of South Carolina.
E-mail: