Measuring the Size of the Economy -- the GDP
Market system
The U.S. economy is basically a market system. In a market system:
-
Resources, and finished goods and services are privately owned, bought,
and sold.
-
Buying and selling is by voluntary choice,
The market system dominates the U.S. economy. But no economy, not even
the U.S., is a pure market economy.
- Inside households, people do things
for each other (services) and give things to each other (goods) without
demanding payment in money.
- Outside their households, people do volunteer work and give charity.
The GDP does not assign a value
to these flows of goods and services.
Health care involves considerable unpaid work by family and friends,
as well as volunteer work in health care facilities. Health care's part of the
of the total flow of goods and services is even bigger than what the
GDP figures say.
Flows
In a market economy:
-
Resources, goods, and services flow from seller to buyer.
-
Money flows from buyer to seller.
These flows happen over time. Economic activity is going on all the time,
with so much stuff changing hands per day or per year. You have to
measure economic activity over a time period
A rate of flow: Flow = Amount / Time
The circular flow
An economy with private ownership of resources has a circular flow.
It might better be called a loop, rather than circular.
The word "loop" would focus better on the important idea that resources
flow from consumers to producers and then, in the form of finished goods
and services, flow back from producers to consumers. Most economists
use the "circular flow" term, however.
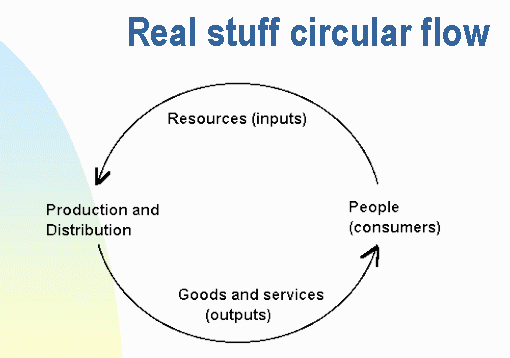
Here's the first stage of a circular flow diagram. In this step, we just
show the flow of real things -- resources, goods, and services.

Resources flow
-
from resource owners (The biggest resource is labor.)
-
to producers of goods and services
Finished goods and services flow
-
from producers
-
to the resource owners, now acting as consumers
-
The reason the resource owners gave up their resources in the first place
was to get goods and services that they wanted to consume.
-
For example, when you take a job you give up your labor resource to get
paid, so you can buy goods and services you need.
A market economy has two circular flows.

In a market system, every good or service that flows is sold and bought,
so every flow of real stuff has a flow of money in the opposite direction.
Real stuff flows from seller to buyer.
Money flows from buyer to seller.
(Money is the universal medium of exchange.)
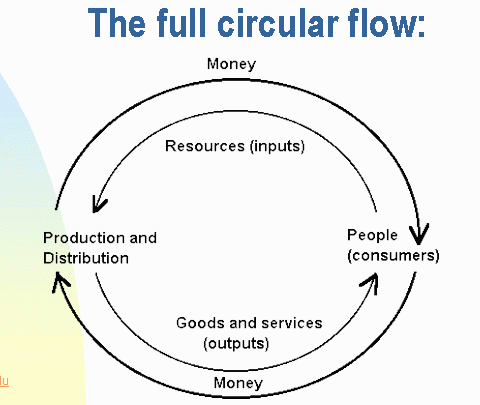
For our diagram, we need two circular flows, one in each direction.
-
One direction is resources, goods, and services.
-
The other direction is money.
Even though there are two flows, economists generally call it the circular
flow. To make the distinction clearer, I'll call it the "full" circular
flow for now.
The full circular flow:

The outer loop in this representation is the flow of money.
The inner loop is the flow of real goods and services.
The flow of money measures the flow of goods and services.
The justification for measuring the flow of goods and services
by the flow of money in the opposite direction is:
- Every real thing that flows (inner loop) from seller to buyer
does so because somebody paid money for it. Presumably, the buyer thought that the real thing was worth at least what he or she paid for it.
- Similarly, the seller is presumed to have thought that the thing was worth no more than the selling price.
- Combine those two ideas, and you've proved that the thing is worth its price.
- This assumes that markets are perfect and competitive, and all exchanges are voluntary.
(If the markets are not perfect or competitive, we use the market price anyway, because it's all we have to go on.)
The nice thing about money values, for GDP purposes, is:
Money can be easily added up.
Adding real products up is
adding apples and oranges.
When you add up the money flow, you get:
Gross Domestic Product (GDP)
The GDP is the flow, per year, through either of the money arrows in the circular flow diagram.
What about goods and services that business and the government use?
 |
This diagram is oversimplified in two important ways:
1. On the right, where it says "People (consumers)," it should also say
"Business and Government." What we want on the right is all final
users of products. Business and government buy lots of goods and
services for their own use, especially capital goods. Those count
in the GDP, too.
2. Imports and exports are missing from this diagram. They would be
represented by additional arrows going out of the loop or coming in. |
The GDP is the flow of money to (or from) producers in the U.S.
The GDP, by measuring the flow of money, indirectly measures the flow
of real stuff.
Gross Domestic Product (GDP)
"Gross" -- No allowance for depreciation
"Domestic" -- Includes only production within the U.S.
"Product" -- Measured by money flow, which means what the product sold
for during the year.
Domestic Product = Domestic Income.
The flow of income (upper half of diagram) equals the flow of product (lower
half of diagram).
GDP (Gross Domestic Product) is defined as
the total $ value of goods and services,
bought by final users,
produced in the U.S.
Final users example:
Iron ore is made into
Steel in generic shapes, which are made into
Automobiles at factories. After shipping, these become
Automobiles at dealers. The automobiles then go to
Consumers.
The consumer is the final user (in this example).
The price that the consumer pays the dealer includes the value of the
iron ore and all the labor and components at each stage.
Certain capital goods that businesses buy do get included in the GDP.
Those are "fixed" capital goods that are used to aid production but don't
become part of the product. The automobile factory buys machines,
as well as raw materials and components. The workers use the machines
to turn the raw materials into cars. The money a business pays for
a machine is counted in the GDP, if the machine is made in the U.S.
It's part of the flow across the lower half of the diagram.
GDP counts only things that are paid for.
Getting back to an issue raised early in this lecture,
non-marketed services and not counted in the GDP. Non-marketed include:
-
work at home by homemakers
-
volunteer work in hospitals and clinics
-
unpaid family work at home to care for invalids discharged from hospitals.
Because of these unpaid costs, the National Health Expendure's percentage
of GDP, high as it is (16% in 2008), understates the percentage of U.S.
resources that go to health care.
Prices -- a stretchy yardstick for measuring the economy
Prices change over time.
The GDP is the sum of the price of each item times the number of that
item sold,
so the GDP changes when prices change, even without any change in real
production.
The problem of price changes and the GDP
How do you separate
GDP changes due to price changes
from GDP changes due to changes in actual production?
You cant do the separation perfectly, because
different items prices change differently.
Prices dont all go up or down together in lock step.
Price Index
A price index is an imperfect solution to separating real from price
changes.
There are many possible price indices (plural of index), depending
on the market basket and the base year.
Market Basket
A collection of goods and services in particular amounts
Represents the buying pattern of the group for which the index is being
designed.
The consumer price index, the wholesale price index, the medical care
component of the consumer price index, etc., have different market baskets.
Different Prices Indices Use Different Market Baskets
The consumer price index uses a market basket representing the average
buying pattern of urban workers families.
The wholesale price indexs market basket represents the average buying
pattern of businesses.
A further complication: Buying patterns change from year to year,
so no one market basket is right for long.
Price Index
As usually done:

The multiplication by 100 is arbitrary. It makes the number easier
to express. Just as in baseball, where we say a player is "hitting 300"
when really we mean his batting average is 0.300 hits per times at bat.
Real and nominal GDP
Nominal GDP is the GDP, the dollar value of all U.S. output in a given
year.
Real GDP is the GDP divided by a price index. (Then multiply
by 100.)
Changes in real GDP approximate the change in real economic activity.
Real means with the effect of price changes taken out as best we
can.
The deflator
The deflator is the price index used by the government to calculate real
GDP.
Its market basket is everything produced in the U.S. in the base year.
It's called "deflator" because its used to reduce the current GDP
number by the amount of price inflation since the base year.
Main concepts
-
Market system
-
Circular flow
-
GDP
-
Price index
E-mail:
The views and opinions expressed in this page are
strictly those of the page author. The contents of this page have not been
reviewed or approved by the University of South Carolina.


